The Yield Curve: How the Bond Market Tries to Predict Recessions
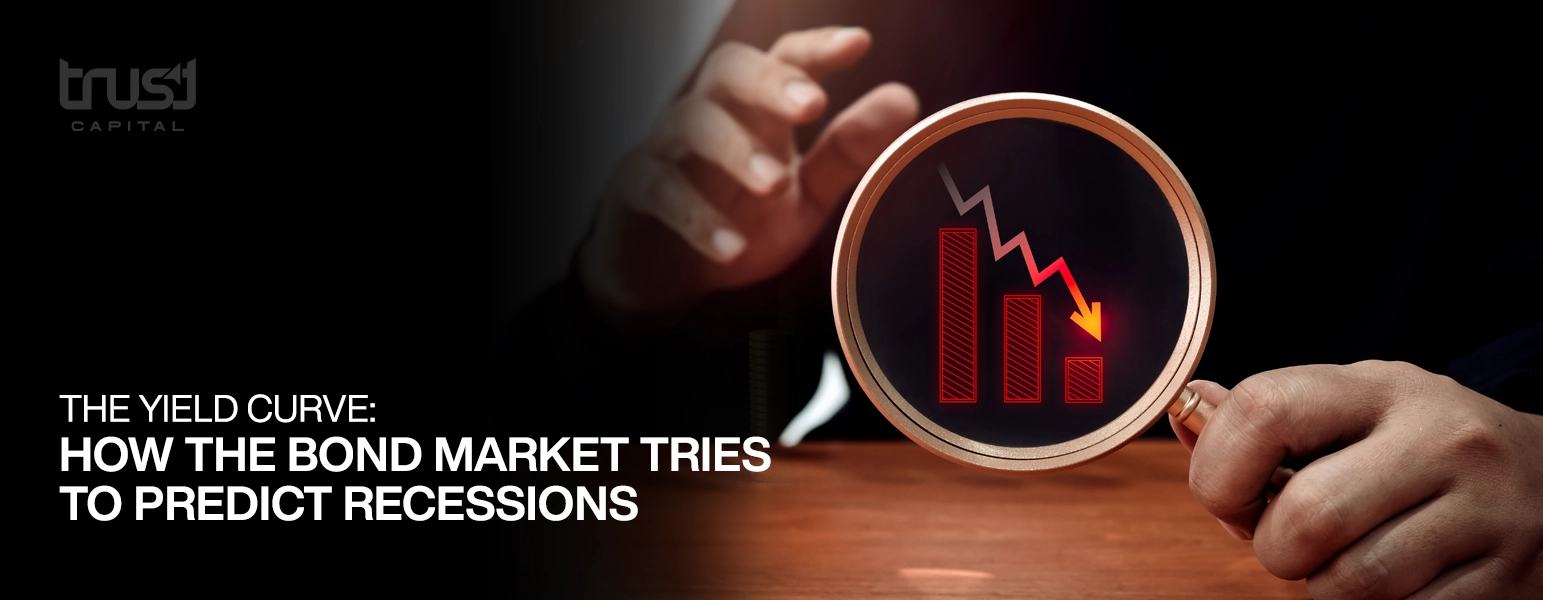
The bond market is often described as one of the most important indicators of economic health. While stock prices tend to reflect corporate earnings expectations, investor sentiment, and growth opportunities, government bond yields can offer valuable clues about inflation, interest rates, and future economic activity.
One of the most closely watched indicators is the yield curve. Its shape can reveal how investors view the relationship between short-term interest rates and long-term economic growth. When the curve becomes inverted, meaning short-term government bond yields rise above long-term yields, investors and economists often pay closer attention to recession risk.
But does an inverted yield curve really predict a recession? And how should investors interpret changing bond yields, Treasury market movements, and economic expectations?
In this guide, we explore the most important yield curve signals, examine historical patterns, and explain how to use bond market indicators to better understand the economic outlook.
What Is the Yield Curve?
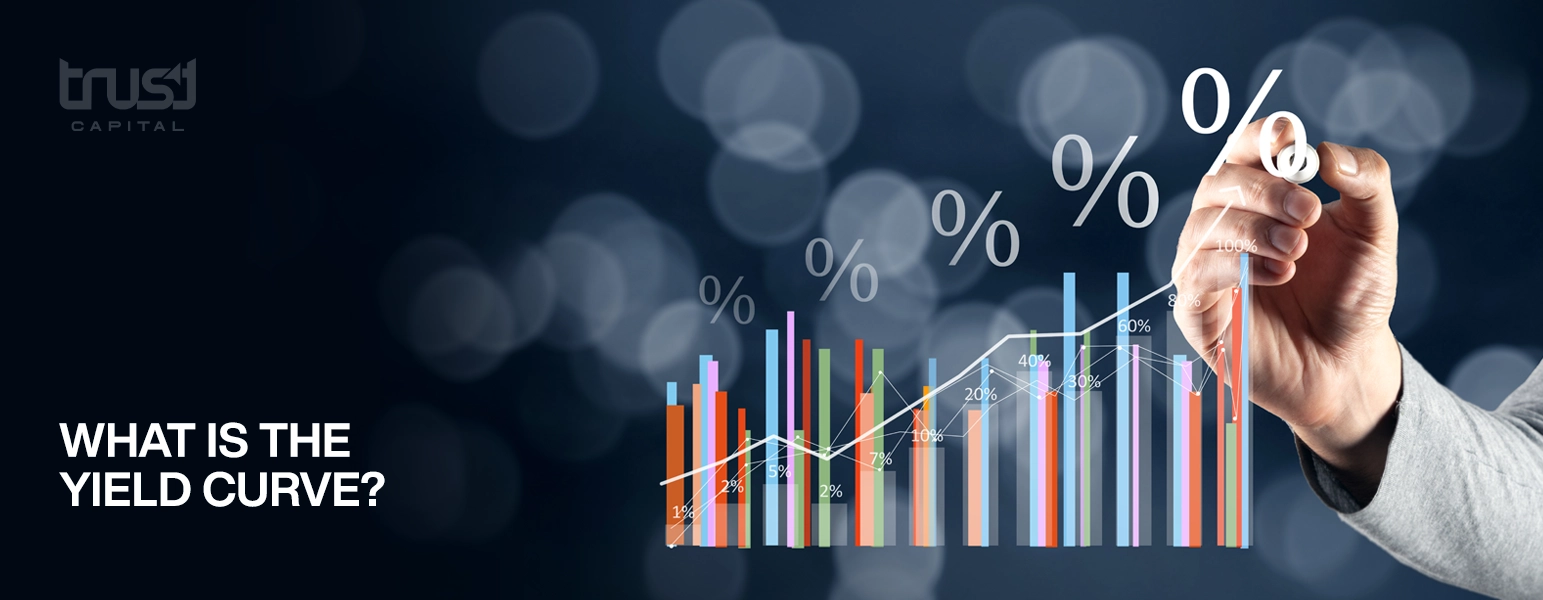
The yield curve is a graph showing the interest rates, or yields, on bonds with different maturities from the same issuer. In the United States, analysts commonly examine yields on U.S. Treasury securities, ranging from short-term Treasury bills to longer-term Treasury notes and bonds.
For example, investors may compare the yields on:
-
3-month Treasury bills
-
2-year Treasury notes
-
5-year Treasury notes
-
10-year Treasury notes
-
30-year Treasury bonds
The relationship between these yields helps illustrate market expectations about interest rates, inflation, and economic growth.
There are three common yield curve shapes.
1. Normal Yield Curve
A normal yield curve slopes upward, with longer-term bonds offering higher yields than shorter-term bonds.
This can reflect expectations of economic growth, future inflation, and the additional compensation investors demand for holding longer-term bonds.
2. Flat Yield Curve
A flat yield curve occurs when short-term and long-term yields are relatively close.
This may indicate uncertainty about future economic conditions or a transition in monetary policy.
3. Inverted Yield Curve
An inverted yield curve occurs when short-term yields exceed long-term yields.
This pattern has historically been associated with several U.S. recessions and is widely monitored as a potential warning sign.
However, the yield curve does not predict every recession perfectly, and an inversion does not guarantee that a recession will occur.
Why Does the Yield Curve Matter?
The yield curve matters because bond yields reflect the interaction between monetary policy, inflation expectations, economic growth forecasts, and investor demand.
Short-term Treasury yields are particularly sensitive to expectations for Federal Reserve policy. When markets expect interest rates to remain high, short-term yields may rise.
Long-term yields reflect a broader combination of expected future short-term rates, inflation expectations, and the term premium investors demand for holding longer-maturity bonds.
When investors expect slower economic growth or future interest-rate cuts, long-term yields may fall relative to short-term yields.
This can flatten or invert the curve.
The key insight is that the bond market is forward-looking. Investors continually adjust prices based on what they expect to happen next, rather than simply reacting to current economic conditions.
Yield Curve Signals: What an Inversion Can Tell Us
Among the most widely discussed yield curve signals is the spread between the 10-year and 2-year U.S. Treasury yields.
The spread is calculated as:
10-year Treasury yield − 2-year Treasury yield
If the 10-year yield is 4% and the 2-year yield is 4.5%, the spread is negative 0.5 percentage points, or negative 50 basis points. This is an inverted 10-year/2-year yield curve.
Another important measure compares the 10-year Treasury yield with the 3-month Treasury bill yield. This spread captures a different maturity relationship and has a long history in recession research.
Why does inversion matter?
When short-term interest rates are high relative to long-term yields, markets may be signalling that monetary policy is restrictive and that future growth or inflation could weaken.
Investors may also expect the Federal Reserve to cut interest rates later if economic conditions deteriorate.
These expectations can push longer-term yields below shorter-term yields.
However, different yield spreads can send different signals, so analysts should avoid relying on one measure alone.
How the Yield Curve Tries to Predict Recessions
The yield curve does not directly forecast a recession. Instead, it reflects market expectations that can be consistent with rising recession risk.
The relationship works through several channels.
1. Higher Short-Term Rates Can Slow Economic Activity
When central banks raise interest rates to control inflation, borrowing costs tend to increase.
Businesses may delay investment, households may reduce borrowing, and demand for interest-sensitive purchases can weaken.
Over time, tighter financial conditions may slow economic growth.
2. Investors May Expect Future Rate Cuts
If investors believe high interest rates will eventually weaken the economy, they may expect the Federal Reserve to cut rates in the future.
That expectation can influence longer-term bond yields and contribute to an inverted curve.
3. Banks and Credit Conditions May Be Affected
Banks often borrow at shorter maturities and lend at longer maturities, although their actual funding and lending structures are more complex.
A flatter or inverted yield curve can put pressure on some traditional lending margins. If lending becomes less attractive or credit standards tighten, businesses and consumers may find it harder to obtain financing.
This can reinforce an economic slowdown, though the impact varies across banks and economic conditions.
4. Markets Anticipate Economic Weakness
Bond investors often adjust their expectations before official economic data confirms a slowdown.
That is one reason the yield curve attracts attention as a leading indicator.
Still, it is a market-based signal, not a definitive prediction of future economic events.
Yield Curve Trends: Why the Direction Matters
Looking at yield curve levels alone may not provide enough information. Investors also monitor yield curve trends to understand how expectations are changing.
Consider four possible developments.
The curve steepens from a normal position. Long-term yields rise relative to short-term yields. This may reflect stronger growth expectations, higher inflation expectations, a rising term premium, or some combination of these factors.
The curve flattens. Short-term yields rise relative to long-term yields, or long-term yields decline relative to short-term yields. This can reflect tighter monetary policy or more cautious expectations about future growth.
The curve becomes inverted. Short-term yields move above long-term yields. This has historically been a recession warning signal in the United States.
The curve steepens after an inversion. This can happen when markets anticipate rate cuts, when short-term yields decline, or when long-term yields rise. It does not automatically mean the economy is recovering.
That last point is particularly important. A steepening curve following an inversion can occur before a recession as well as during an economic transition. The reason for the steepening matters.
Recession Risk Signals Beyond the Yield Curve
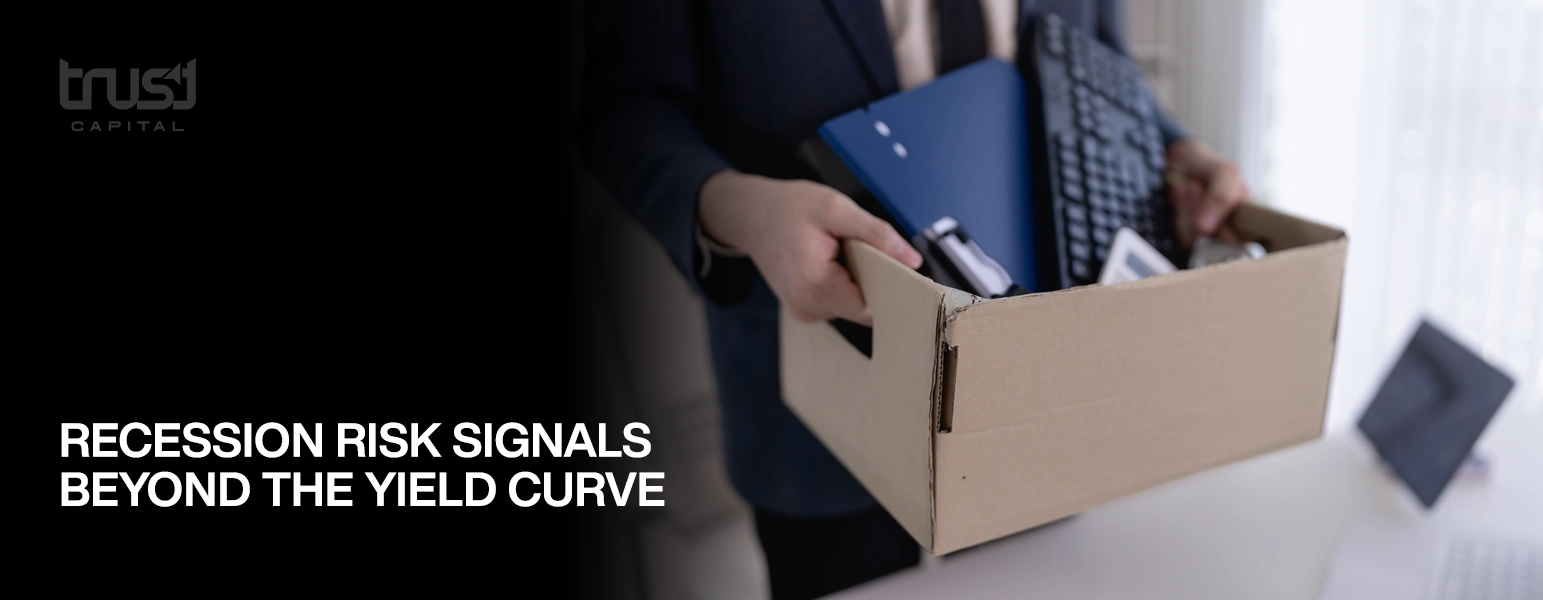
The yield curve is useful, but it should not be treated as a standalone recession forecasting tool.
Investors and analysts often combine it with other recession risk signals, including:
-
Rising unemployment or weakening hiring
-
Slower consumer spending
-
Declining manufacturing activity
-
Tighter bank lending standards
-
Falling business investment
-
Weakening corporate earnings expectations
-
Increasing credit spreads
-
Deteriorating consumer confidence
When several of these indicators weaken at the same time, concerns about a recession may become more substantial.
On the other hand, if the yield curve is inverted while employment, consumption, and business activity remain resilient, the economic outlook may be more complicated than the curve alone suggests.
The goal is to assess a range of indicators rather than interpret one signal in isolation.
Bond Yield Forecasts: What Moves Treasury Yields?
Reliable bond yield forecasts require an understanding of the forces that influence bond prices and interest rates.
Bond prices and yields move in opposite directions: when the price of an existing fixed-rate bond rises, its yield generally falls, and vice versa.
Several factors can influence Treasury yields.
Federal Reserve policy
Expectations for the federal funds rate have a particularly strong influence on short-term Treasury yields.
Inflation expectations
Investors generally demand compensation for expected inflation. If inflation expectations increase, nominal yields may rise, although other forces can offset that effect.
Economic growth
Stronger growth expectations can contribute to higher yields, while concerns about slower growth can support demand for government bonds.
Treasury supply and demand
Government borrowing, investor demand, and the amount of duration the market must absorb can affect yields.
The term premium
Investors may require additional compensation for the risks of holding longer-term bonds. This compensation is known as the term premium.
Consequently, long-term yields can rise even when markets expect weaker economic growth or future rate cuts.
This is one reason bond yield forecasts should account for more than just Federal Reserve policy.
Top Bond Market Trends to Watch
The most useful top bond market trends are those that help explain how investors are reassessing economic conditions.
1. Changes in Treasury yield spreads
Monitoring the 10-year/2-year and 10-year/3-month spreads can help identify changes in the curve's shape.
2. The relationship between short- and long-term yields
A move in short-term yields may reflect changing policy expectations, while a move in long-term yields may also reflect inflation expectations and the term premium.
3. Inflation-linked Treasury yields
Yields on Treasury Inflation-Protected Securities, or TIPS, can provide useful information about market-based real yields.
4. Credit spreads
The difference between corporate bond yields and comparable Treasury yields can indicate how investors assess credit risk.
5. Treasury auction demand
Auction results can help analysts assess demand for government debt, although an individual auction should not be treated as a complete market signal.
These indicators can help put yield curve movements into a broader context.
Top Yield Curve Trends: What Investors Should Look For
When analysing the top yield curve trends, it helps to ask three questions.
Is the curve inverted?
An inversion may indicate that investors expect future interest rates to be lower than current short-term rates. It can also reflect restrictive monetary policy and concerns about growth.
Is the inversion becoming deeper or shallower?
The change can reveal how market expectations are evolving. However, the direction alone does not establish whether recession risk is increasing or decreasing.
What is driving the change?
A curve can steepen because short-term yields fall, because long-term yields rise, or because both happen at once. These scenarios can carry very different economic implications.
A useful analysis therefore examines both the yield spread and the underlying movements in each maturity.
Top Bond Market Outlook: How to Interpret the Signals
A sensible top bond market outlook should consider several possible economic scenarios rather than assume that the yield curve guarantees one outcome.
Scenario 1: Inflation declines and growth remains stable
If inflation moves toward the central bank's target without a major economic slowdown, markets may anticipate gradual policy easing. The curve's response will depend on how short- and long-term expectations change.
Scenario 2: Inflation remains persistent
If inflation stays elevated, central banks may keep interest rates restrictive for longer. Short-term yields could remain high, potentially keeping the curve flat or inverted.
Scenario 3: Economic activity weakens sharply
Investors may anticipate faster rate cuts and seek the relative safety of government bonds. Short-term yields may fall as policy expectations change, while long-term yields respond to growth, inflation, and term-premium dynamics.
Scenario 4: Long-term yields rise despite weaker growth
If investors demand greater compensation for duration risk, or if Treasury supply and inflation concerns push up the term premium, long-term yields can rise even as economic momentum weakens.
This final scenario highlights why the bond market cannot be interpreted using a simple rule that weaker growth always means lower yields.
Top Treasury Yield Trends: Understanding the Bigger Picture
The top Treasury yield trends worth monitoring include both nominal and real yields.
Nominal yields represent the stated return on Treasury securities. Real yields attempt to measure returns after accounting for inflation expectations or inflation adjustments, depending on the measure used.
Changes in real yields can influence investment decisions across a wide range of assets, including stocks, gold, and inflation-sensitive securities.
Treasury yields also provide a reference point for borrowing costs throughout the economy. Mortgage rates, corporate borrowing costs, and other financial rates may be influenced by Treasury market movements, although the relationship is not one-to-one.
For recession analysis, it is helpful to distinguish between a rise in yields caused by stronger growth expectations and a rise caused by inflation concerns or a higher term premium.
The same yield movement can tell very different stories depending on its cause.
Best Yield Outlook: How to Build a Balanced Forecast
The best yield outlook is not necessarily the forecast that predicts the exact direction of every Treasury maturity. It is one that identifies the most important drivers and acknowledges uncertainty.
A practical framework includes five steps:
-
Assess monetary policy. Consider whether central-bank policy is restrictive, neutral, or becoming more accommodative.
-
Review inflation data. Look at both current inflation and expectations for future inflation.
-
Track economic momentum. Examine employment, consumer spending, manufacturing, and business investment.
-
Analyse the yield curve. Compare multiple maturity spreads and observe how they change over time.
-
Consider term-premium and supply factors. Recognize that long-term yields can move for reasons beyond expected policy rates.
Combining these elements can produce a more informed outlook than relying on one indicator or one market narrative.
Bond Trends Guide 2026: A Practical Monitoring Routine
This bond trends guide 2026 provides a simple way to follow the market without becoming distracted by every daily movement.
Weekly:
-
Review Treasury yields across major maturities.
-
Check changes in key yield curve spreads.
-
Monitor credit spreads and major economic developments.
When important economic data is released:
-
Compare inflation, employment, and growth data with market expectations.
-
Observe how short-term and long-term Treasury yields respond.
-
Consider whether the data changes expectations for monetary policy.
After Federal Reserve meetings:
-
Review policy decisions and forward guidance.
-
Assess changes in market expectations for future rates.
-
Check whether the yield curve steepened or flattened and identify the main driver.
Over the longer term:
-
Compare financial-market signals with actual economic activity.
-
Avoid treating one inversion, one data release, or one bond-market rally as conclusive evidence.
Consistency matters more than reacting to every market headline.
Bond Market News 2026: Why Context Is More Important Than Headlines
Following bond market news 2026 can help investors understand changing expectations, but individual headlines can be misleading without context.
A sharp drop in Treasury yields could reflect expectations of weaker growth, lower inflation, anticipated rate cuts, or increased demand for safe assets.
A rise in yields could reflect stronger growth expectations, persistent inflation, heavier Treasury supply, or a higher term premium.
Similarly, a steepening yield curve is not automatically bullish, and an inversion is not an immediate recession announcement.
The most useful question is always: What changed, why did it change, and does other evidence support that interpretation?
That approach turns bond-market headlines into a more meaningful economic analysis.
Yield Trends Guide 2026: Five Questions to Ask
Use this yield trends guide 2026 whenever you review the Treasury market.
-
Is the yield curve normal, flat, or inverted?
-
Are short-term or long-term yields driving the change?
-
What are markets expecting from the Federal Reserve?
-
Are inflation, employment, and growth data confirming those expectations?
-
Are credit spreads and lending conditions pointing to greater financial stress?
These questions help separate a temporary market movement from a broader shift in the economic outlook.
Final Thoughts: The Yield Curve Is a Warning Signal, not a Crystal Ball
The yield curve remains one of the most closely watched indicators of U.S. recession risk because it captures important information about interest rates, monetary policy expectations, and investors' views of the future.
An inversion can provide a meaningful warning, but it cannot tell us precisely when a recession will begin, how severe it will be, or whether one is inevitable.
The most effective approach is to combine yield curve signals with employment trends, inflation, credit conditions, consumer spending, and other measures of economic activity.
For readers tracking yield curve trends, bond yield forecasts, top bond market trends, best yield outlook, or bond market news 2026, the essential lesson is simple: the bond market can offer valuable clues about what may lie ahead, but those clues become more useful when interpreted together.
The yield curve is not a crystal ball. It is one important piece of evidence in a much larger economic picture.